Get Started
Scan to Download App
iOS & Android
BitMart / Crypto / QTUM

Qtum (QTUM)

$
$ 0.60 (QTUM/USD)
-1.61%
24H

Qtum Live Price data

Today's price of Qtum Is $ 0.60 (QTUM/USD). With A Market Cap Of $ 64.67M USD. 24-Hour Trading Volume Of $ 4.14M USD, A 24-Hour Price Change Of -1.61%, And A Circulating Supply Of 106.15M QTUM.

Qtum QTUM Price History USD

Track the price of Qtum for today, 7 days, 30 days and 90 days
Period
Change
Change (%)
Today
$ 0.0099
-1.61%
7days
--
--
30days
--
--
90days
--
--

Own QTUM Now

Buy and sell QTUM easily and securely on BitMart.
Buy/Sell QTUM Now
Buy/Sell {0} Now
Qtum Market Information
Last price $ 0.60
$ 0.60 24h Range $ 0.61
All time high
‎$ 0‎
All time low
‎$ 0‎
24h Change
‎-1.61%‎
24h Vol
‎$ 4,135,887.98‎
Circulating supply
106.14M QTUM
Market cap
‎$ 64.67M‎
Max supply
107.82M QTUM
Fully diluted market cap
‎$ 65.68M‎
Trade QTUM

Earn

Put your idle crypto to work and earn passive income through savings, staking, and more.
Try Now
Try Now

Qtum X Insight

avatar
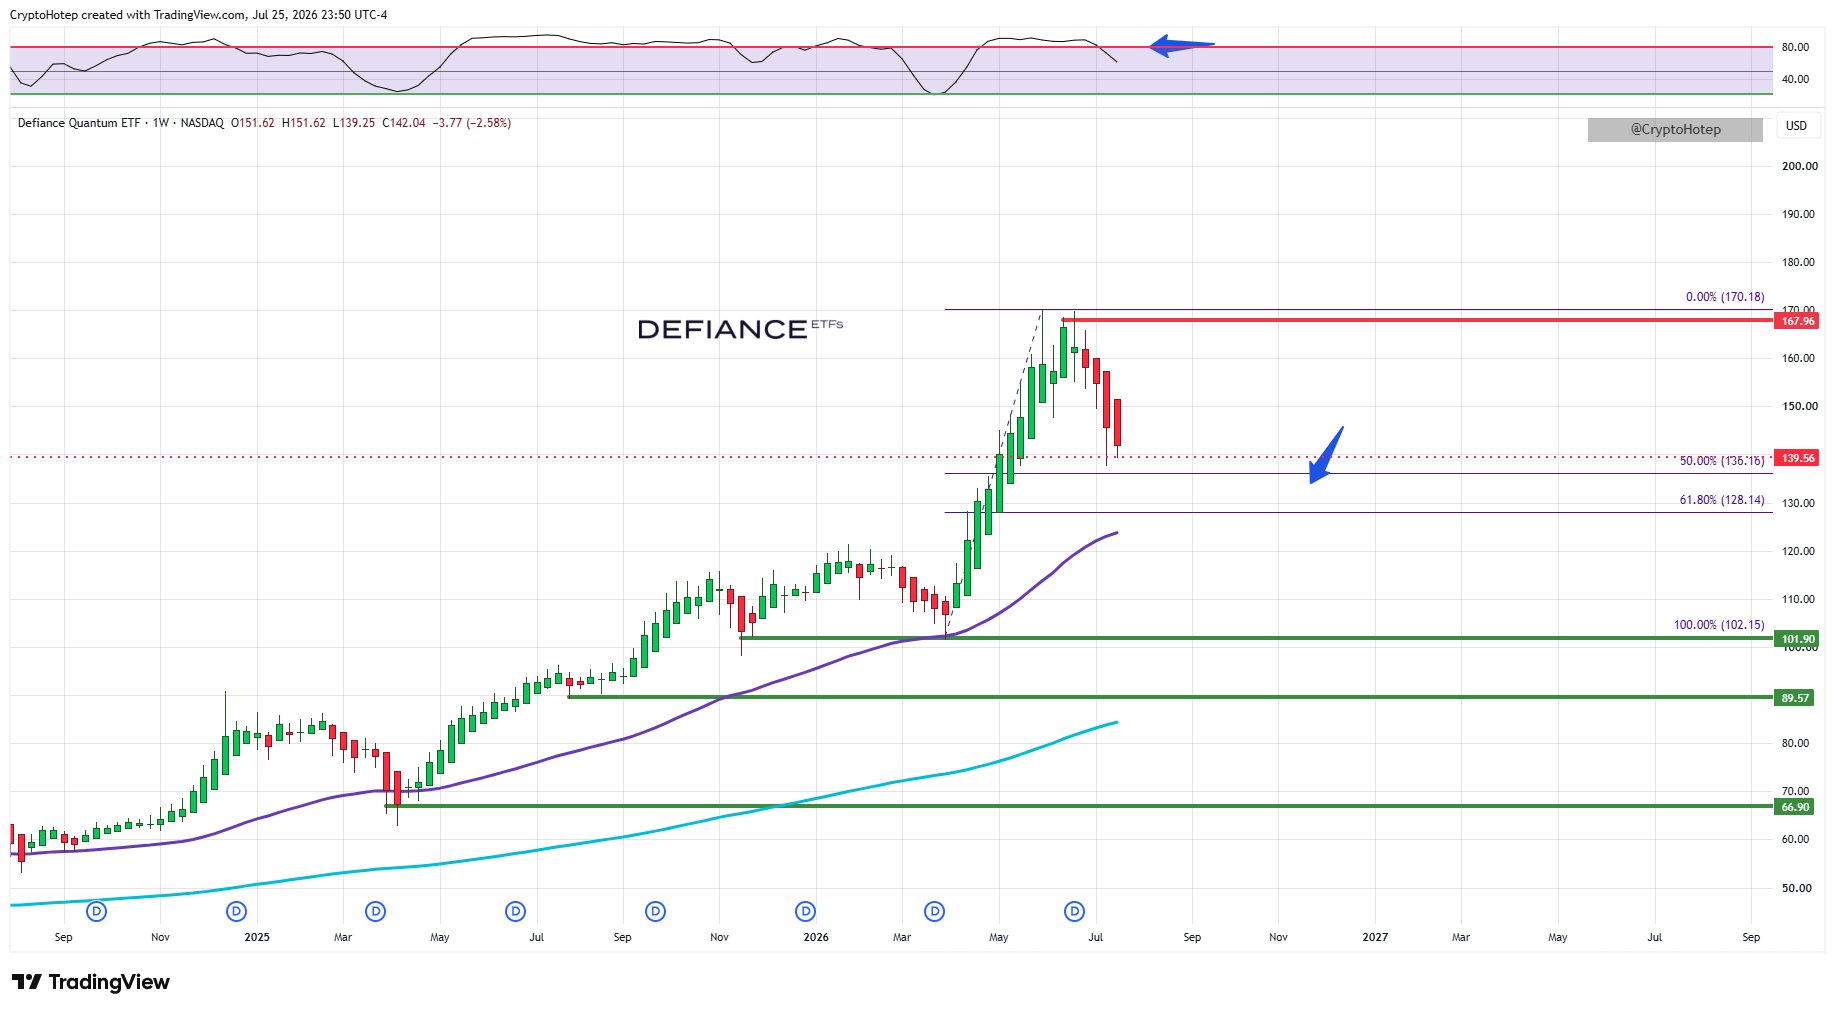
QTUM-related ETF pulls back to the Fibonacci zone; the author remains bullish and looks for support.

Quantum computing getting hit hard and my ETF portfolio in our 'Family Portfolio' is feeling it, with QTUM being a position in it.

I feel as though this is a much a needed breather and we could see a potential near term landing spot in the Golden Fib Zone ($128 - $136) and until we break a major level of demand/support, we are still bullish.

$QTUM
view 0
view 0
view 210
2026-07-26 03:57
Trend of QTUM after release
Bullish
QTUM-related ETF pulls back to the Fibonacci zone; the author remains bullish and looks for support.
avatar
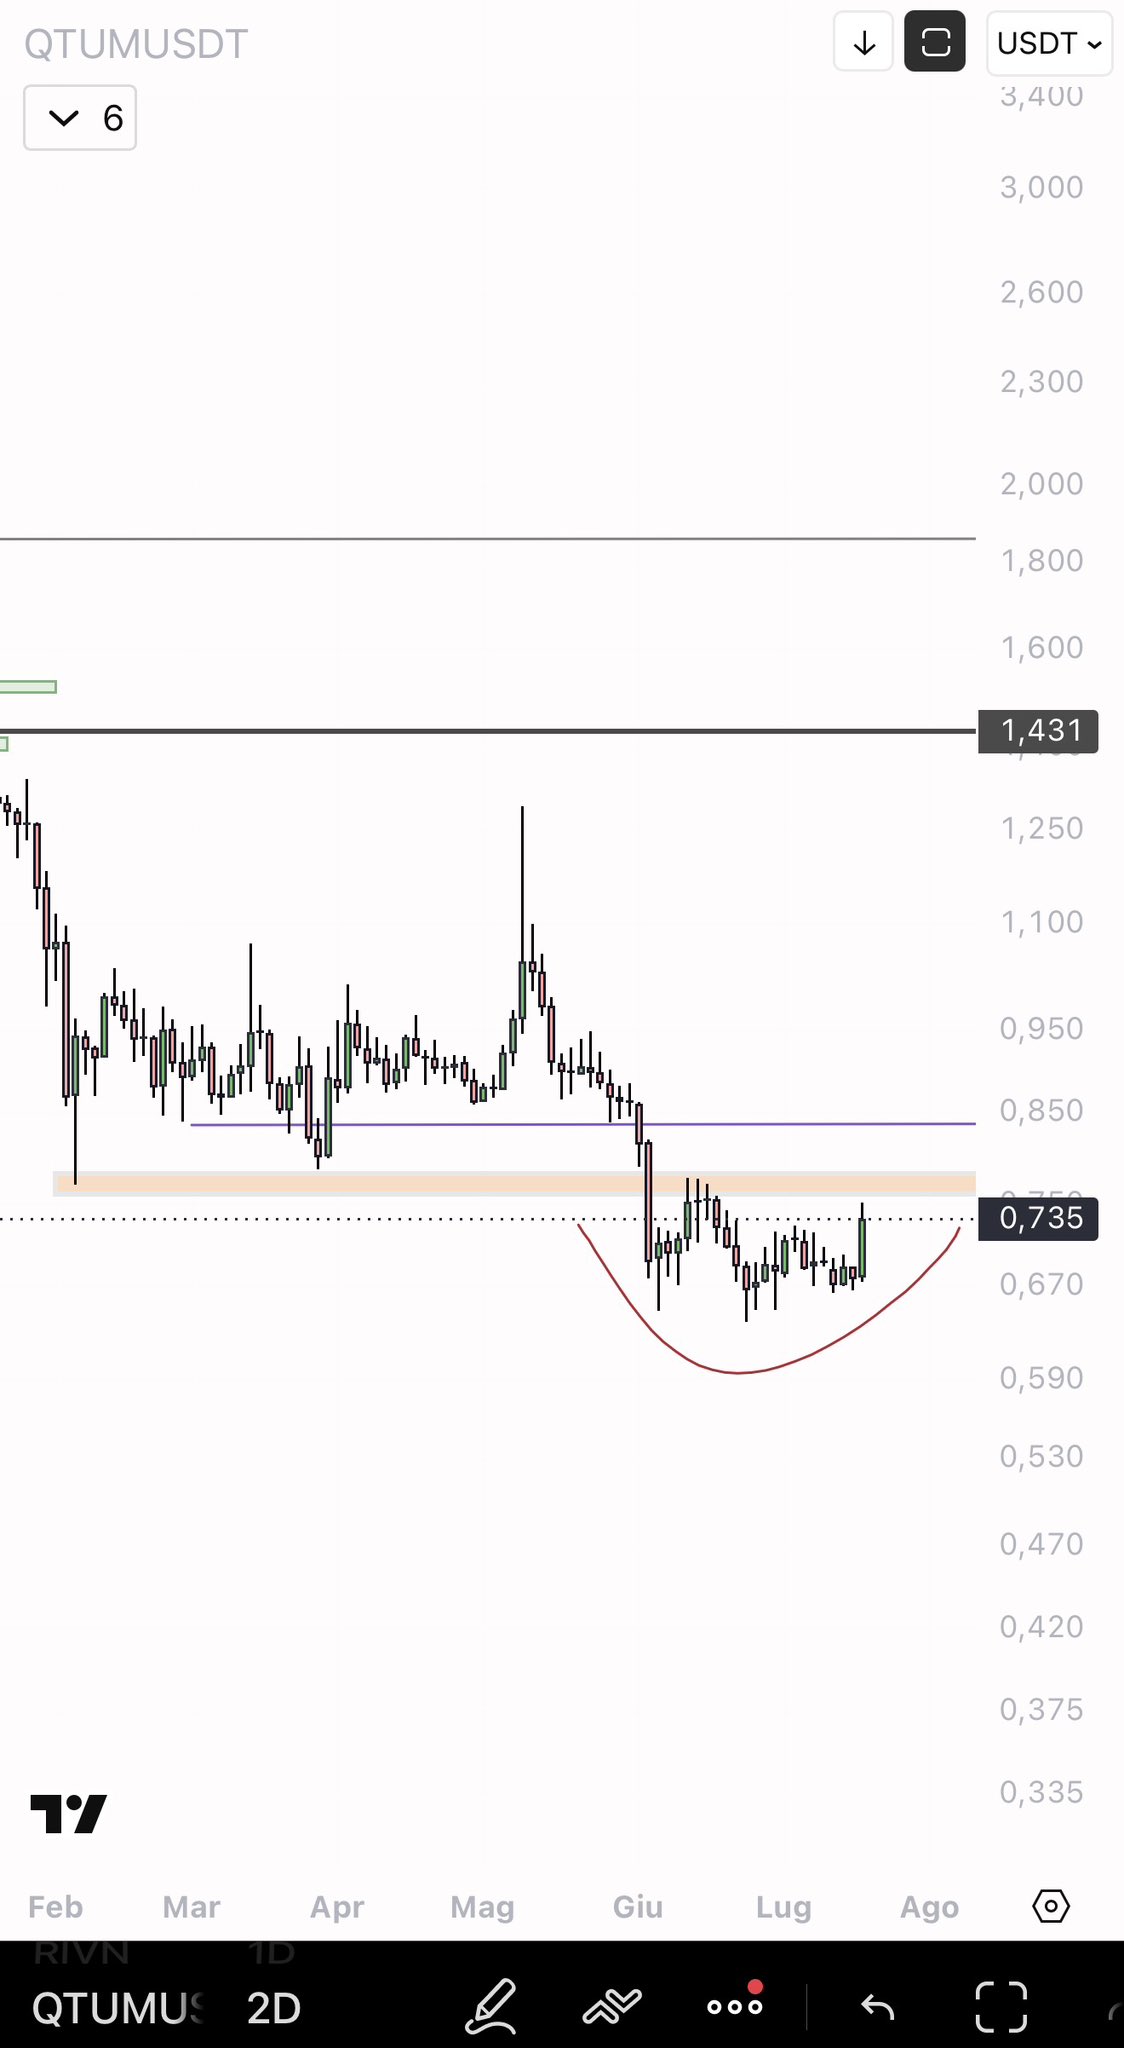
QTUM technical chart shows a potential bullish pattern, and the author is optimistic about its upside potential.

$QTUM very like this setup https://t.co/3Zm5bFLsJm

view 375
view 42
view 63.3K
2026-07-23 13:17
Trend of QTUM after release
Bullish
QTUM technical chart shows a potential bullish pattern, and the author is optimistic about its upside potential.
avatar
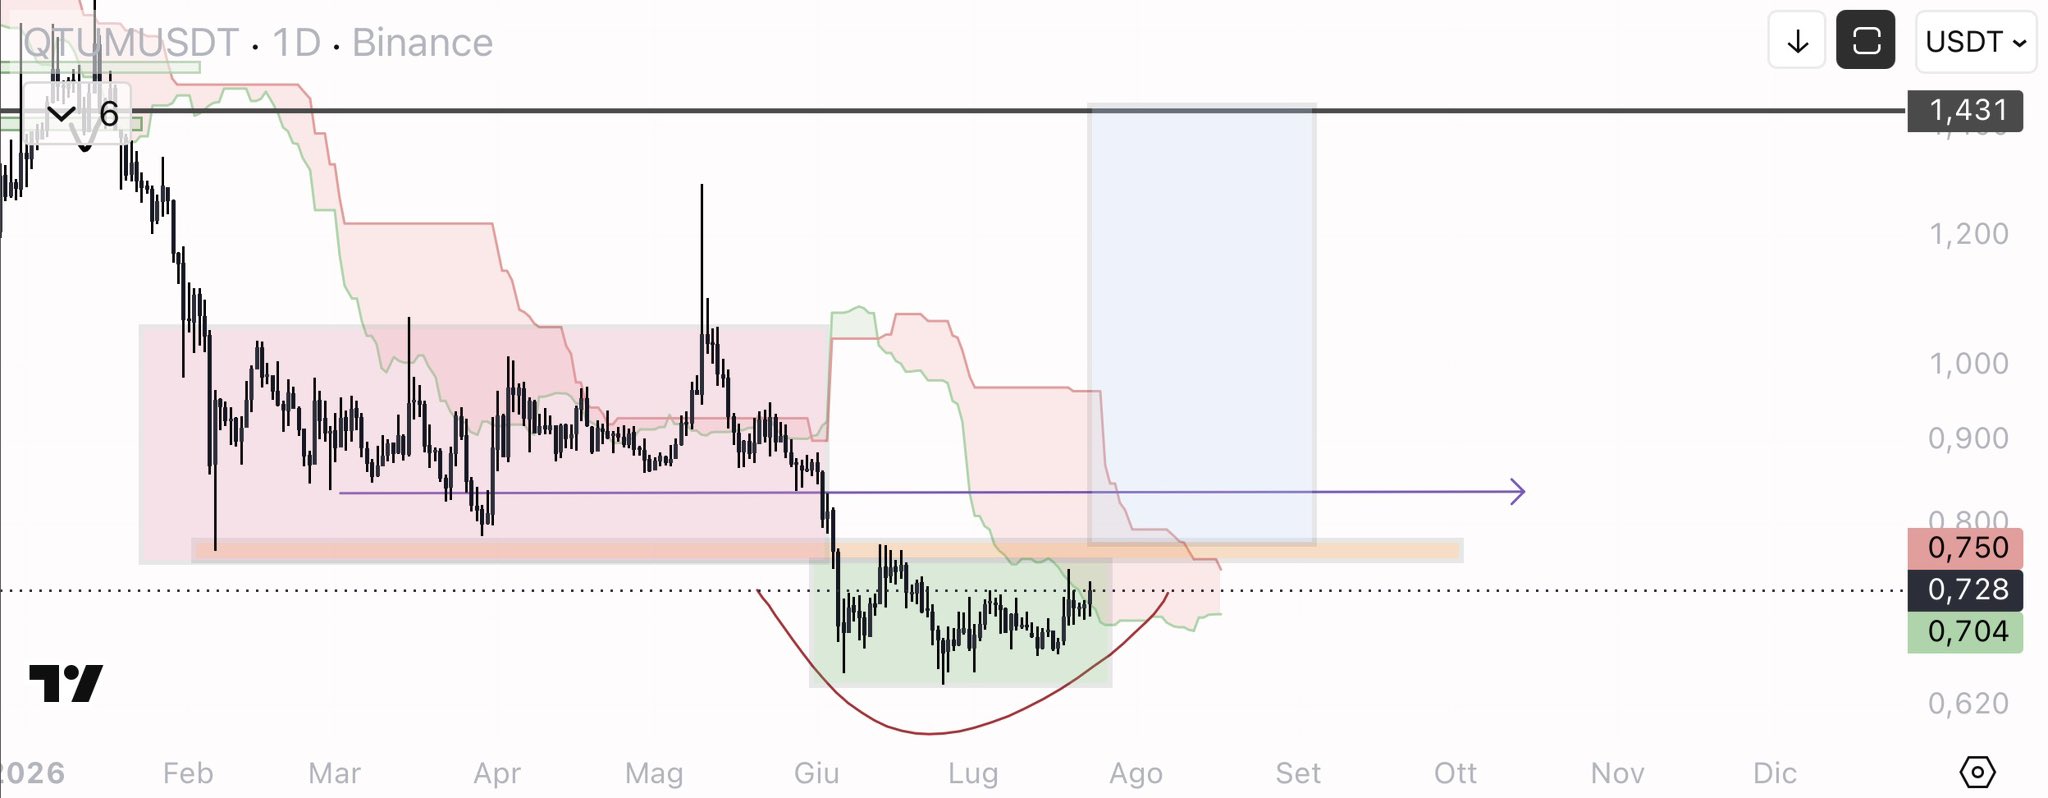
The QTUMUSDT chart shows a potential rounded bottom pattern, watch the volume to confirm a trend reversal.

$QTUM

It will be interesting to see whether the volume confirms a deviation and, consequently, a trend reversal https://t.co/QooZmrxxCP

view 293
view 53
view 62.8K
2026-07-19 16:07
Trend of QTUM after release
Bullish
The QTUMUSDT chart shows a potential rounded bottom pattern, watch the volume to confirm a trend reversal.
Details
About Qtum
Qtum (QTUM) is a cryptocurrency launched in 2017. Qtum has a current supply of 107,822,406 with 106,149,406.5 in circulation. The last known price of Qtum is 0.64459363 USD and is up 0.34 over the last 24 hours. It is currently trading on 326 active market(s) with $6,780,264.66 traded over the last 24 hours. More information can be found at https://qtum.org/.
Read More
Buy QTUM
Trade QTUM