Rewards
Futures Daily Draw
100% Chance To Win With Daily Trades
Spot Daily Draw
Win 8,888 USDT In Grand Prizes
Mobile Top-Up
Top up mobiles easily, online, secure
Send
Send money globally, fast and secure
BitMart Mall
Live on crypto

Avantis Live Price data
Today's price of Avantis Is $ 0.095 (AVNT/USD). With A Market Cap Of $ 31.31M USD. 24-Hour Trading Volume Of $ 740.24K USD, A 24-Hour Price Change Of +1.29%, And A Circulating Supply Of 329.04M AVNT.
Avantis AVNT Price History USD
Track the price of Avantis for today, 7 days, 30 days and 90 days
Period
Change
Change (%)
Today
$ 0.0010
1.11%
7days
$ 0.0021
-2.18%
30days
$ 0.0086
-8.37%
90days
$ 0.033
-26.22%
Own AVNT Now
Buy and sell AVNT easily and securely on BitMart.
Avantis Market Information
$ 0.093 24h Range $ 0.096
All time high
$ 2.66
All time low
$ 0.086
24h Change
1.29%
24h Vol
$ 740,243.89
Circulating supply
258.20M
AVNT
Market cap
$ 24.57M
Max supply
1.00B
AVNT
Fully diluted market cap
$ 95.16M
Trade AVNT

Avantis X Insight

Sehaj
Founder
Derivatives_Expert
S
 6.1K @0xSehaj
 Bullish
AVNT achieves $100M OI, zero-fee perpetuals, and buyback & burn, outlook is positive

Piyush D ∿ D
3.0K @314yush June was huge for @avantisfi. Here’s what we shipped:
- +$100M OI capacity: 7 FX majors (USD/JPY $50M+), Gold ($30M), Silver ($20M) - lowest spread onchain to trade FX & Metals
- Zero-Fee Perps live: EURUSD + GBPUSD - zero fees upfront w/ upto 500x leverage.
- Over 3M $AVNT bought-back and burnt!
- Listed $SPCX $SNDK $MU $BABA $EWY
- @base MCP shipped: AI assistant now talks to Avantis - one prompt is all it takes!
- PWA live, add avantis to your home screen & trade it like any other app.
- Trading Floor launched: A place for top avantis traders to talk markets!
We've been silently undergoing an evolution, and now we begin revealing it to the world 🫡
 44
44
 7
7
 3.4K
3.4K
2026-07-06 01:37
Trend of AVNT after release
Bullish
AVNT achieves $100M OI, zero-fee perpetuals, and buyback & burn, outlook is positive

Kurnia Bijaksana
Trader
Educator
C
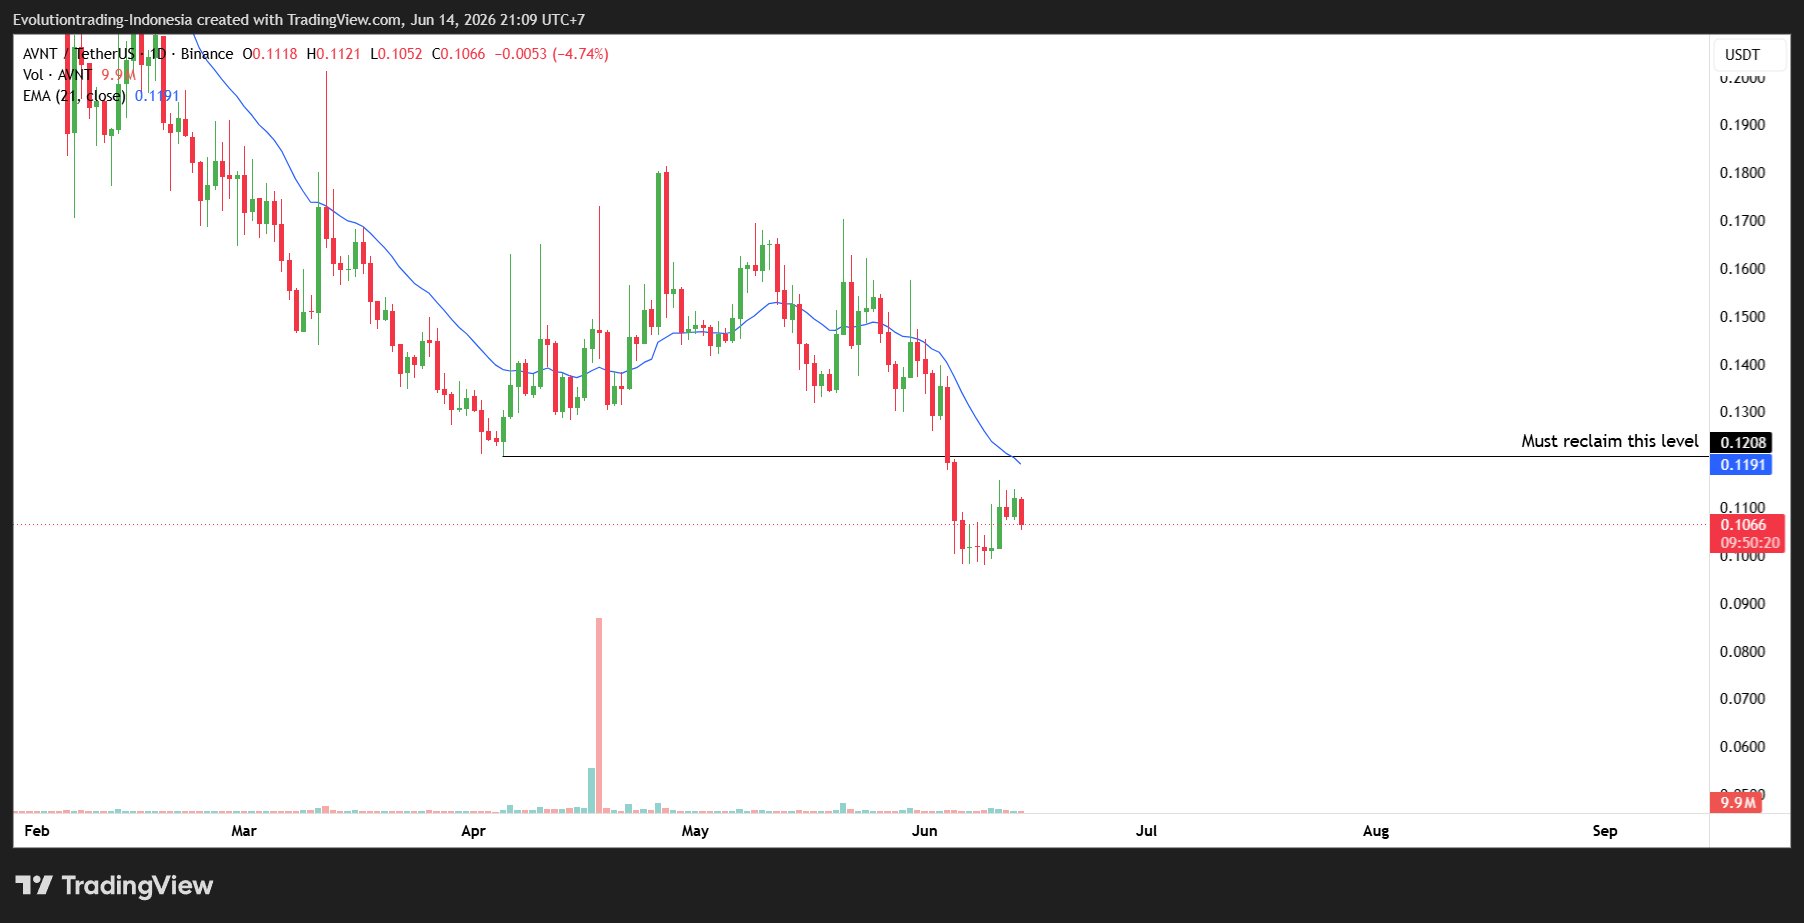
46.9K @mkbijaksana Extremely Bearish
AVNT trend remains bearish; must reclaim $0.12 to reverse.
AVNT
trend still bearish, unless can reclaim $0.12 https://t.co/vaOjRT0saU
 3
0
1.0K
3
0
1.0K
2026-06-14 14:27
Trend of AVNT after release
Bearish
AVNT trend remains bearish; must reclaim $0.12 to reverse.

Our Crypto Talk
Media
OnChain_Analyst
C
79.7K @ourcryptotalk Extremely Bullish
市场疲软时,多款山寨币持有者增长,显示投资者高度信念和积累。
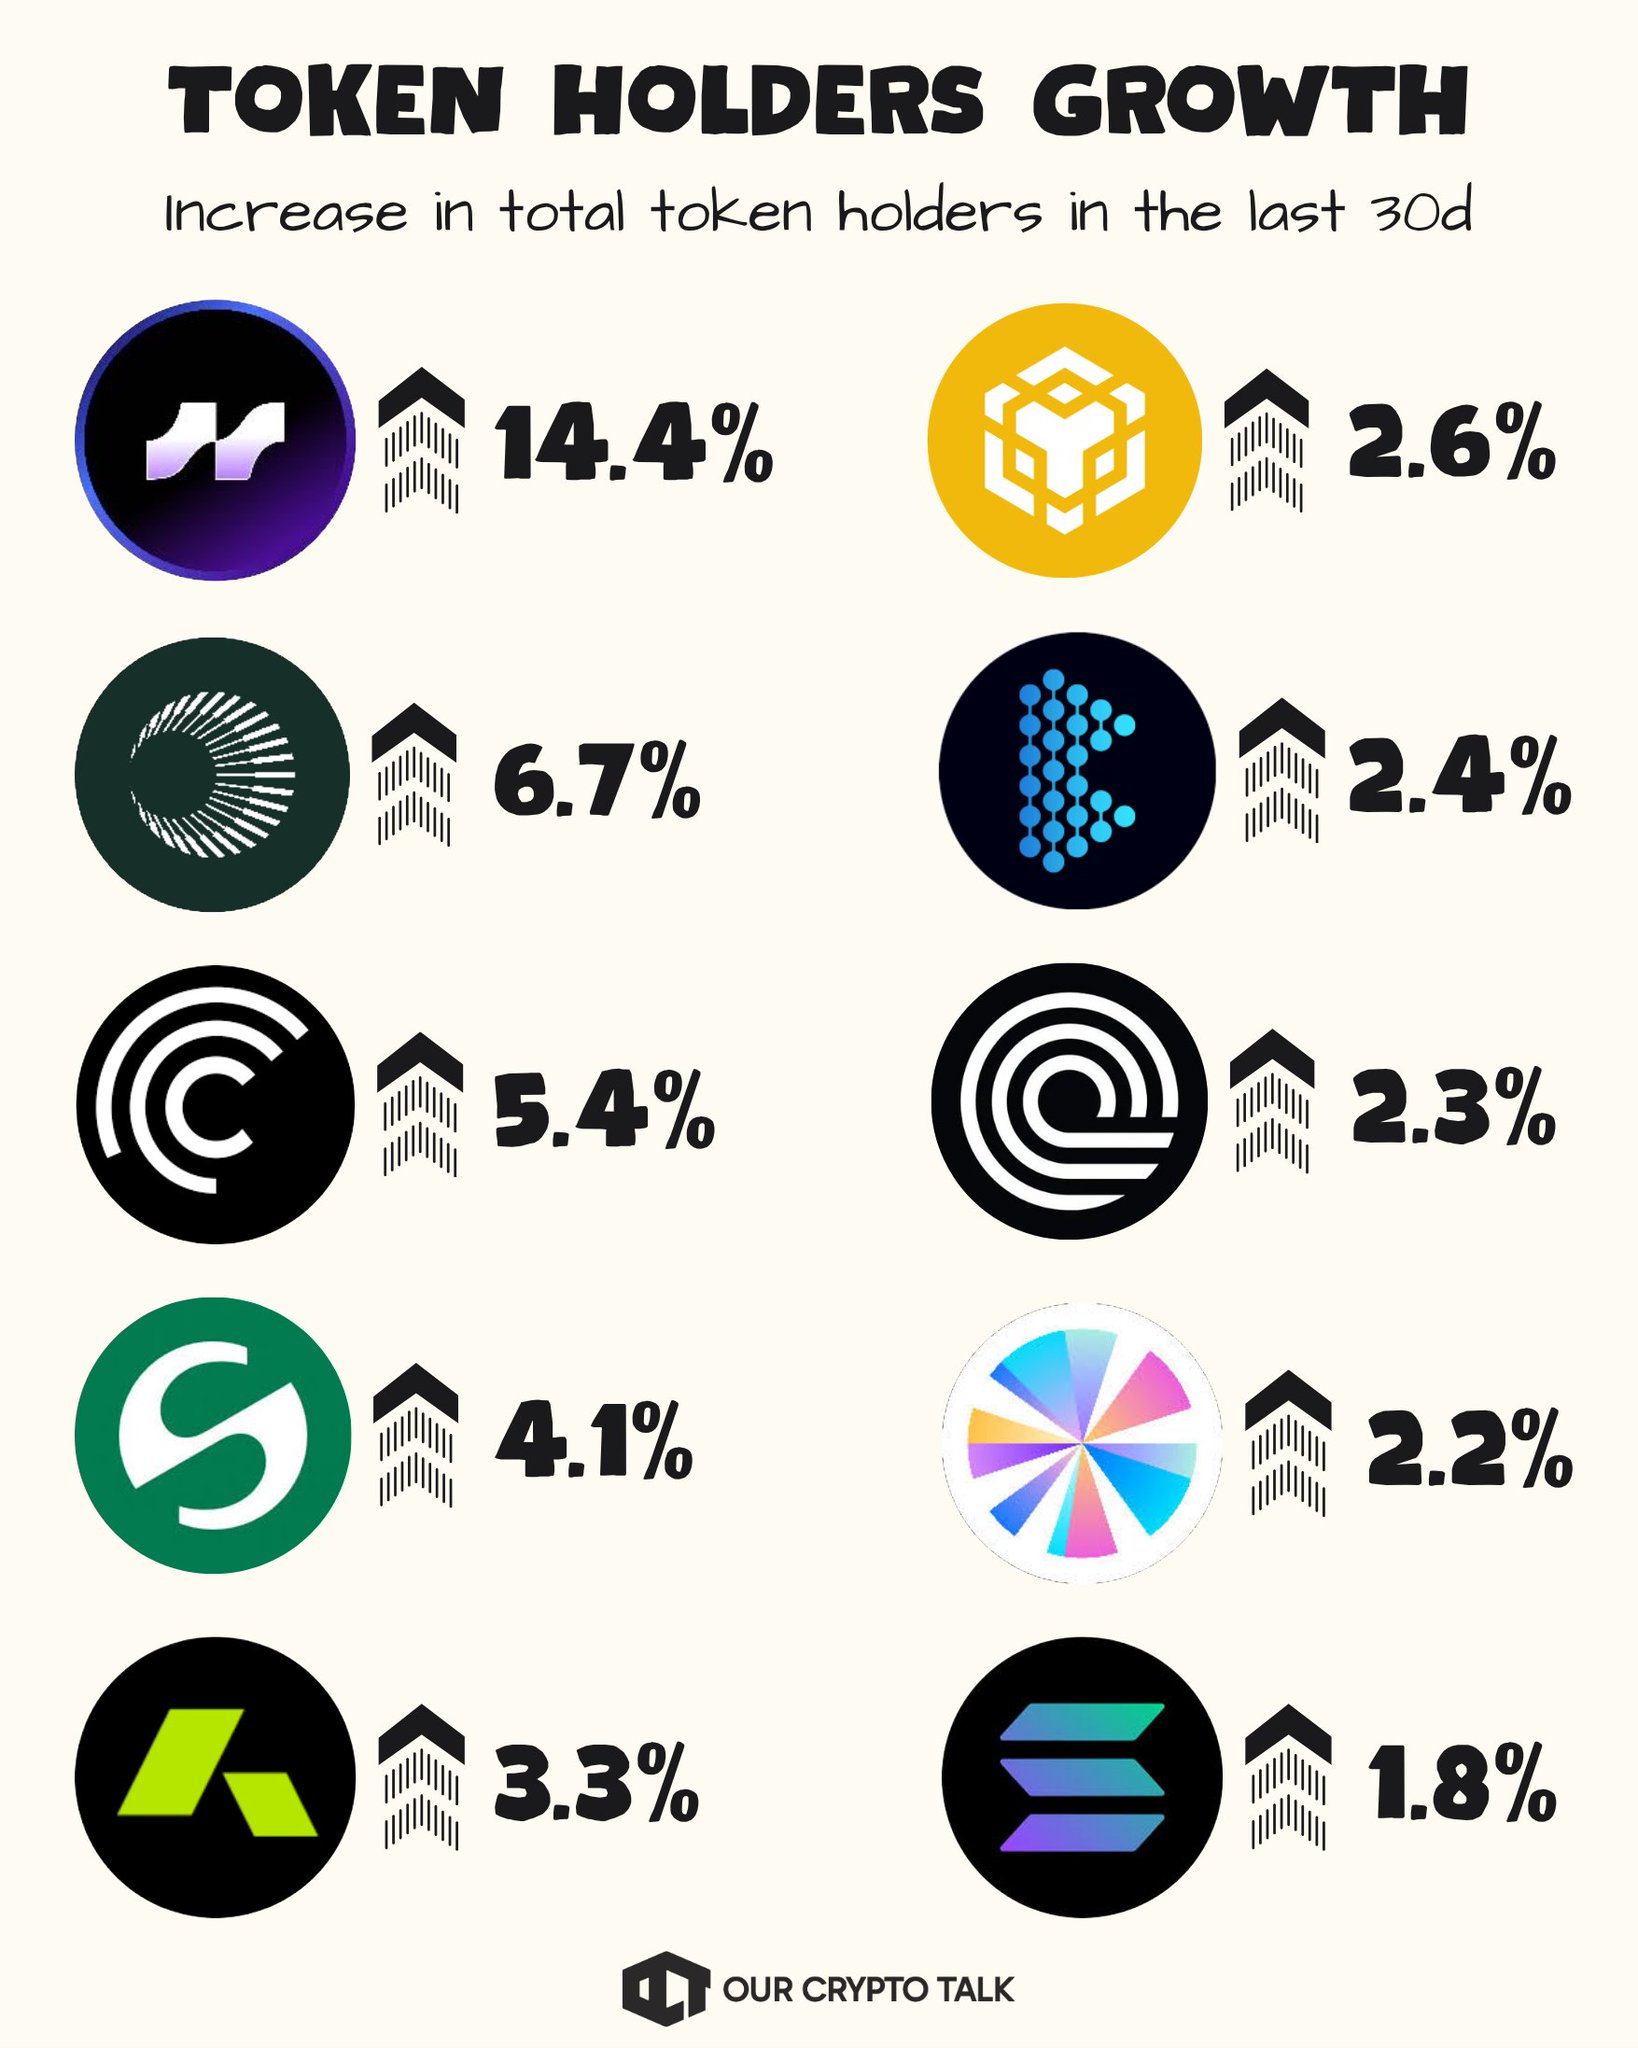
Token Holders Increase in 30d 👀
$AVNT +14.4%
$XPL +6.7%
$CFG +5.4%
$STABLE +4.1%
$ACU +3.3%
$BNB +2.6%
$BKN +2.4%
$ONDO +2.3%
$SKY +2.2%
$SOL +1.8%
This tells a lot about projects that are currently gaining trust from investors.
Why?
Because when prices are red, hype disappears.
No one is buying just because the chart looks good or chasing green candles.
The only people entering are either believers, long-term allocators, or users who actually see value in the project.
So if an Altcoin is still adding holders while the market is weak, it tells you something important.
Demand is not dead, community is not leaving.
And accumulation is happening quietly while attention is elsewhere.
Price shows fear and holder growth shows conviction.
 38
4
2.5K
38
4
2.5K
2026-06-09 16:37
Trend of AVNT after release
Extremely Bullish
市场疲软时,多款山寨币持有者增长,显示投资者高度信念和积累。
Price Prediction
When is a good time to buy AVNT? Should I buy or sell AVNT now?
When deciding whether it’s a good time to buy or sell Avantis (AVNT), it’s important to first align with your own trading strategy and risk profile.Long-term investors and short-term traders often interpret market conditions differently, so your decision should reflect your personal approach. According to the latest AVNT 4-hour technical analysis, the current trading signal is Hold. According to the latest AVNT 1-day technical analysis, the current signal is Hold.

Beacon Prediction
Probabilistic Price Forecast (Next 24 Hours)Beacon Prediction Disclaimer
The data results displayed on this page are analyzed based on actual trading data (OHLCV) of the selected trading pair along with corresponding technical indicators.
This prediction is an experimental technical product and is provided for reference purposes only. It does not constitute investment advice. Unexpected real-world events may significantly impact market behavior. Traders should make decisions with caution.
This prediction is an experimental technical product and is provided for reference purposes only. It does not constitute investment advice. Unexpected real-world events may significantly impact market behavior. Traders should make decisions with caution.
About Avantis
Avantis (AVNT) is a cryptocurrency launched in 2023and operates on the Base platform. Avantis has a current supply of 1,000,000,000 with 329,041,443.47860123 in circulation. The last known price of Avantis is 0.09476268 USD and is down -1.88 over the last 24 hours. It is currently trading on 259 active market(s) with $16,426,161.31 traded over the last 24 hours. More information can be found at https://www.avantisfi.com/.
Read More
Explore More
BM Discovery


New Listing

HALON Halliburton
-- 0.00%

WMBON Williams Companies
-- 0.00%

STMON STMicroelectronics
-- 0.00%

EQTON EQT Corporation
-- 0.00%

APHON Amphenol
-- 0.00%

TIPON iShares TIPS Bond ETF
-- 0.00%

SYMON Symbotic
-- 0.00%

COPXON Global X Copper Miners ETF
-- 0.00%

SLBON SLB
-- 0.00%

LCAI Lightchain AI
-- 0.00%
Buy AVNT
Trade AVNT