One chart doesn't call a market bottom.
But one chart can teach you what a bottom often looks like.
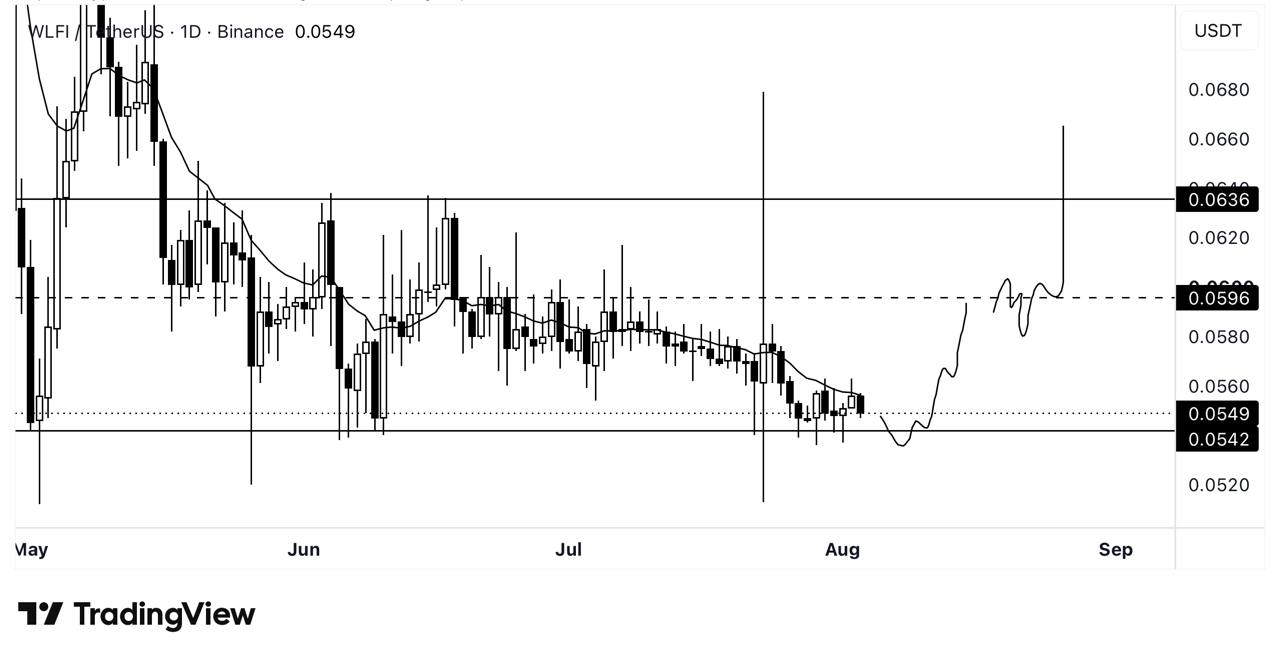
I'm using $WLFI as a structural case study.
Here's what I'm looking for:
- A completed five-wave impulsive decline.
- Selling momentum begins to fade (RSI improves while price stops falling).
- Volume contracts as panic selling dries up.
- Price enters a tight consolidation range instead of making new lows.
- Shorts become increasingly vulnerable to squeezes.
None of these signals alone confirm a bottom. But when several of them begin appearing at the same time, the probability of a major trend reversal increases.
What's most interesting is I'm seeing similar characteristics across #BTC, #Total3, and several other charts. I don't look for one magic indicator.
I look for confluence.
That's where conviction comes from.
#Crypto #Bitcoin #TechnicalAnalysis #MarketStructure #PriceAction #Altcoins #Investing #Trading #WLFI