Rewards
Futures Daily Draw
100% Chance To Win With Daily Trades
Spot Daily Draw
Win 8,888 USDT In Grand Prizes
Mobile Top-Up
Top up mobiles easily, online, secure
Send
Send money globally, fast and secure
BitMart Mall
Live on crypto

Plasma Live Price data
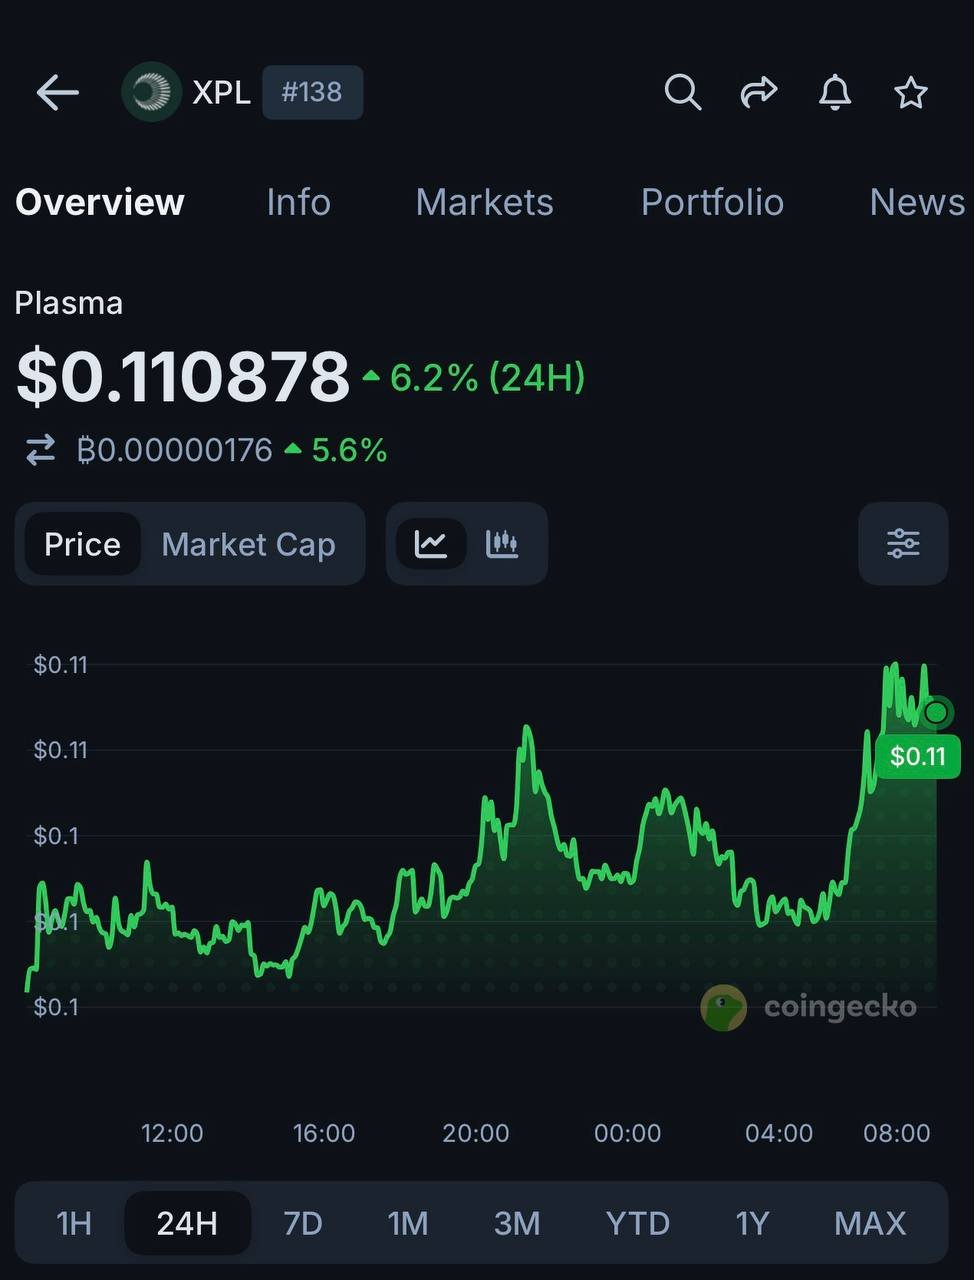
Today's price of Plasma Is $ 0.11 (XPL/USD). With A Market Cap Of $ 198.57M USD. 24-Hour Trading Volume Of $ 6.53M USD, A 24-Hour Price Change Of +3.96%, And A Circulating Supply Of 1.80B XPL.
Plasma XPL Price History USD
Track the price of Plasma for today, 7 days, 30 days and 90 days
Period
Change
Change (%)
Today
$ 0.0035
3.38%
7days
$ 0.0077
7.62%
30days
$ 0.044
67.99%
90days
$ 0.011
-9.30%
Own XPL Now
Buy and sell XPL easily and securely on BitMart.
Plasma Market Information
$ 0.10 24h Range $ 0.11
All time high
$ 1.69
All time low
$ 0.060
24h Change
3.96%
24h Vol
$ 6,534,538.95
Circulating supply
1.80B
XPL
Market cap
$ 198.57M
Max supply
10.00B
XPL
Fully diluted market cap
$ 1.10B
Trade XPL

Plasma X Insight

Osemka
TA_Analyst
Trader
A
 19.9K @Osemka8
 Bullish
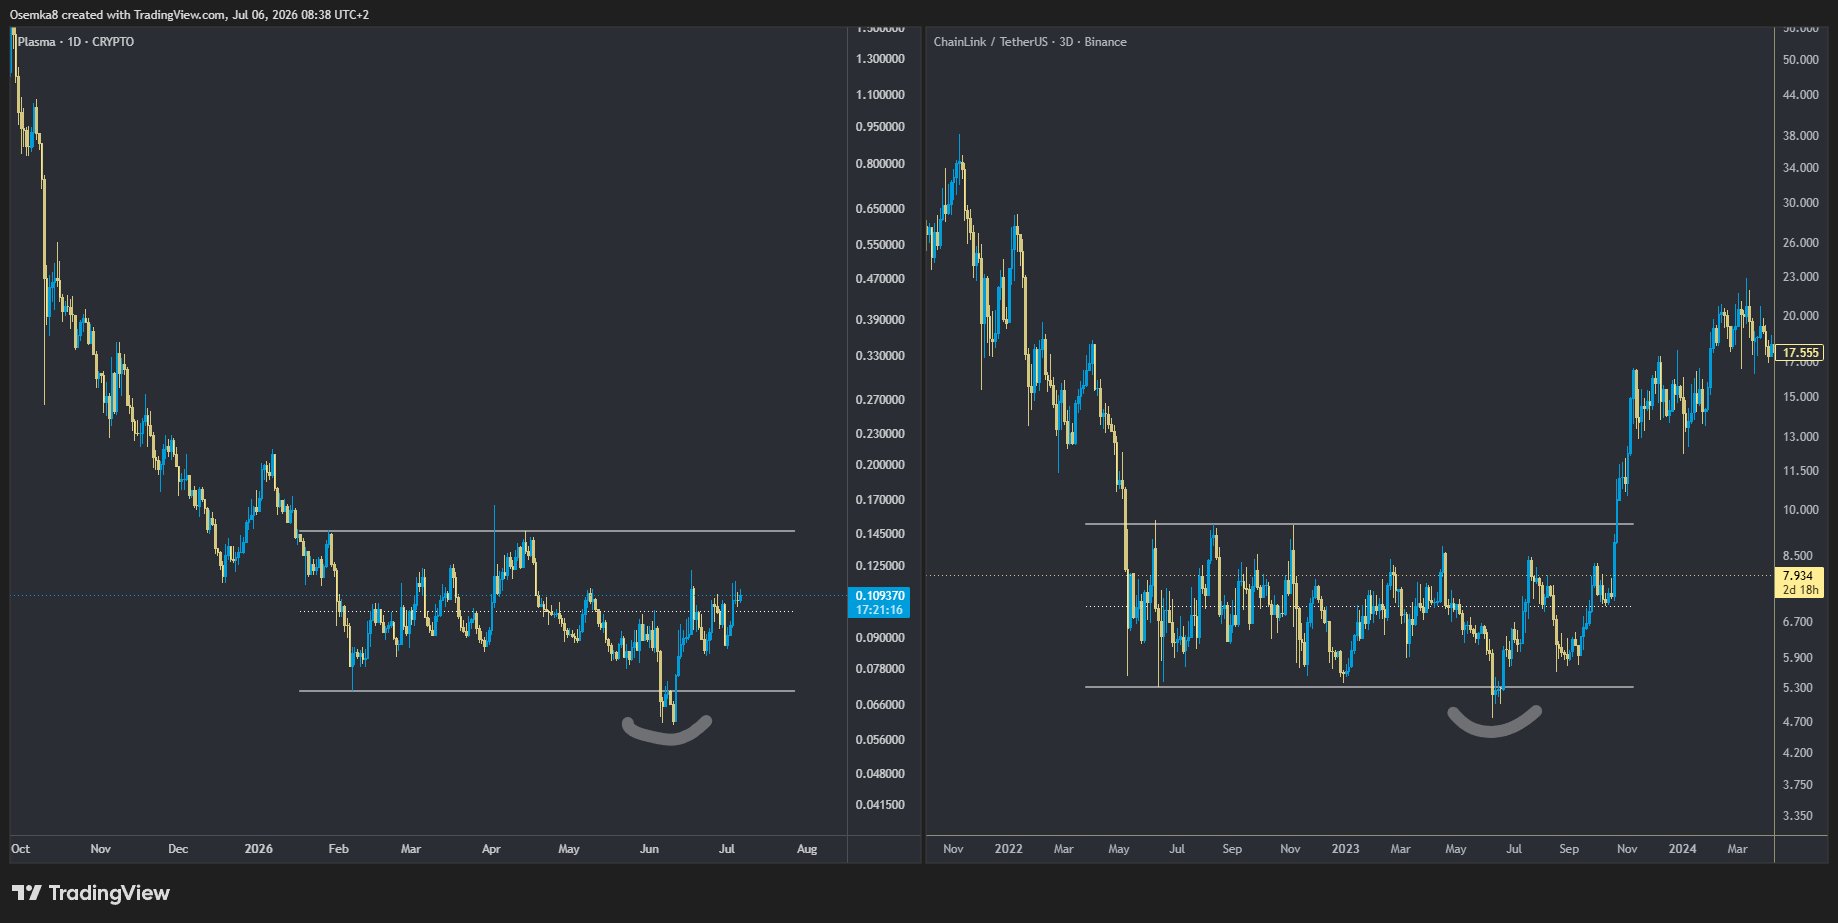
The XPL chart pattern looks strikingly similar to LINK's pre‑rise shape in 2023, suggesting a potential breakout.
Osemka
TA_Analyst
Trader
A
19.9K @Osemka8 $XPL reminds me of $LINK sweep in 2023 https://t.co/ZAE9hb2eKE
 45
45
 4
4
 5.2K
5.2K
2026-07-06 17:57
Trend of XPL after release
Bullish
The XPL chart pattern looks strikingly similar to LINK's pre‑rise shape in 2023, suggesting a potential breakout.
Osemka
TA_Analyst
Trader
A
19.9K @Osemka8 Extremely Bullish
The XPL chart pattern looks strikingly similar to LINK's pre‑rise shape in 2023, suggesting a potential breakout.
$XPL reminds me of $LINK sweep in 2023 https://t.co/ZAE9hb2eKE
45
4
5.2K
2026-07-06 07:17
Trend of XPL after release
Extremely Bullish
The XPL chart pattern looks strikingly similar to LINK's pre‑rise shape in 2023, suggesting a potential breakout.

Shuarix™
TA_Analyst
Trader
B
44.4K @Shuarix Extremely Bullish
The author is bullish on the future development of on-chain finance and believes Plasma will occupy an important position.
I keep coming back to the same conviction: finance moving onchain it's where I think the industry is heading
The biggest winners won't necessarily be the chains themselves, but the apps that make crypto feel invisible to everyday users... many asked me about Plasma
I don't really see this as a fight between neobanks, I think the entire market gets bigger as more people move to onchain financial products
I'm not expecting it to happen overnight, but if that narrative keeps playing out, plasma:native could be in a really strong position over the next few years
 181
41
6.9K
181
41
6.9K
2026-07-06 05:12
Trend of XPL after release
Extremely Bullish
The author is bullish on the future development of on-chain finance and believes Plasma will occupy an important position.
Price Prediction
When is a good time to buy XPL? Should I buy or sell XPL now?
When deciding whether it’s a good time to buy or sell Plasma (XPL), it’s important to first align with your own trading strategy and risk profile.Long-term investors and short-term traders often interpret market conditions differently, so your decision should reflect your personal approach. According to the latest XPL 4-hour technical analysis, the current trading signal is Hold. According to the latest XPL 1-day technical analysis, the current signal is Sell.

Beacon Prediction
Probabilistic Price Forecast (Next 24 Hours)Beacon Prediction Disclaimer
The data results displayed on this page are analyzed based on actual trading data (OHLCV) of the selected trading pair along with corresponding technical indicators.
This prediction is an experimental technical product and is provided for reference purposes only. It does not constitute investment advice. Unexpected real-world events may significantly impact market behavior. Traders should make decisions with caution.
This prediction is an experimental technical product and is provided for reference purposes only. It does not constitute investment advice. Unexpected real-world events may significantly impact market behavior. Traders should make decisions with caution.
About Plasma
Plasma (XPL) is a cryptocurrency launched in 2025. Plasma has a current supply of 10,000,000,000 with 1,800,000,000 in circulation. The last known price of Plasma is 0.10597528 USD and is down -1.31 over the last 24 hours. It is currently trading on 290 active market(s) with $95,153,517.81 traded over the last 24 hours. More information can be found at https://www.plasma.to/.
Read More


Buy XPL
Trade XPL